- Identify Problems: Convene the community to articulate and concretize technical issues and challenges in the application of altmetrics data
- Collaborate (hack): Explore and begin building solutions for these needs -
- Improve existing applications: PLOS ALM, ImpactStory, ScienceCard
- Make new standalone applications
- Work on something that integrates the different ALM apps, e.g. a source interesting to all of them, a mashup with data from different tools
- Raise Awareness: Seed concrete ideas and raise awareness amongst the user groups (funders, publishers, researchers, administrators) of the potential for tools to -
- Advance adoption of altmetrics within each target group and across research ecosystem
- Address specific pain/friction points which lower barriers to adoption of altmetrics use cases
Final projects
- Paul Groth
- Mark Hahnel
- Patrick Hayes
- Jack LaBarba
- Jason Priem
- Juan Alperin
- Carl Boettiger
- Martin Fenner
- Mahboob Imtiyaz
- Karthik Ram
- Matt Senate
- Nina Stoletzki
- Anna Daniel
- Nettie Lagace
- Heather Piwowar
- Xenia van Edig
- Alicia Woodleigh
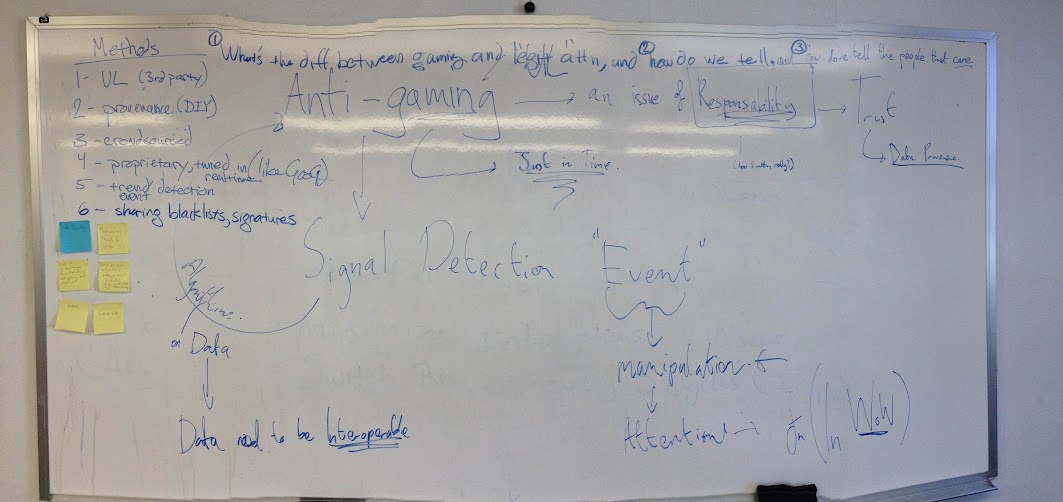 The 6 technical ideas that came out of the workshop were:
- UK - 3rd party (I have no idea what that means)
- Provide provenance, and the ability for consumers to run the data themselves
- Crowdsource detection of fraud
- Have proprietary anti-gaming strategies, so cheaters don’t know how to cheat.
- Look for trend and event detection algorithms that could signal the possibility of something dodgy.
- Create a shared blacklist amongst ALM providers.
It was also suggested that in terms of strategies for looking for problems in the data, we should do the simplest dumbest thing first. We might also organise a hackathon specifically pitching one team against another, with one team out to break some metric, and the other team set to defend the metric, as a way of stress testing the system.
When it came to the day of the hackathon there were enough people interested in the general topic that we decided to have a go at something. We only had a few hours, so we decided to pick a simple atomic example of trying to find a signal in the data. There was a lot of discussion around whether this would be useful, if we didn’t initially know what that signal would represent, and that is a fair point, however there was sufficient interest to give it a go.
The idea is that changes in altmetrics activity express the changing levels of interest in a research artefact. The specific pattern of activity depends on the metric being considered (e.g., journal page views, Tweets, bookmark, etc.). Spikes in activity are of interest as they may indicate either sudden interest in a paper (e.g., mainstream news coverage, prize awarded to an author) or manipulation of metrics (i.e., gaming). We wanted to get some data, apply a tool suitable for detecting a signal, and show that such a tool could be used with altmetric data. We were then going to visualise the events. We felt that a working demo could be extended to a more generally applicable tool for the whole ALM community.
What we did
To begin, we packaged the data to construct time sequence vectors for each of our sample articles, a subset of 2000 articles in the PLOS corpus. We then identified a set of possible approaches to evaluate the data: hidden or semi-hidden Markov models, switching Poisson (SP) process, Rank Surprise method, etc. The most recent applications are capable of adaptive event detection by incorporating Bayesian learning to Poisson models. We didn’t have much time, and after identifying a set of algorithms that might do the job for us, we did a search for ready to hand implementations in R. We found a recently released R package that applies Kleinberg’s burst detection algorithm, and given that was available we decided to apply that. The data we had prepared was not in exactly the right format, so we wrote one more data processing step to wrangle the data a bit more, and we ran the algorithm on some real data.
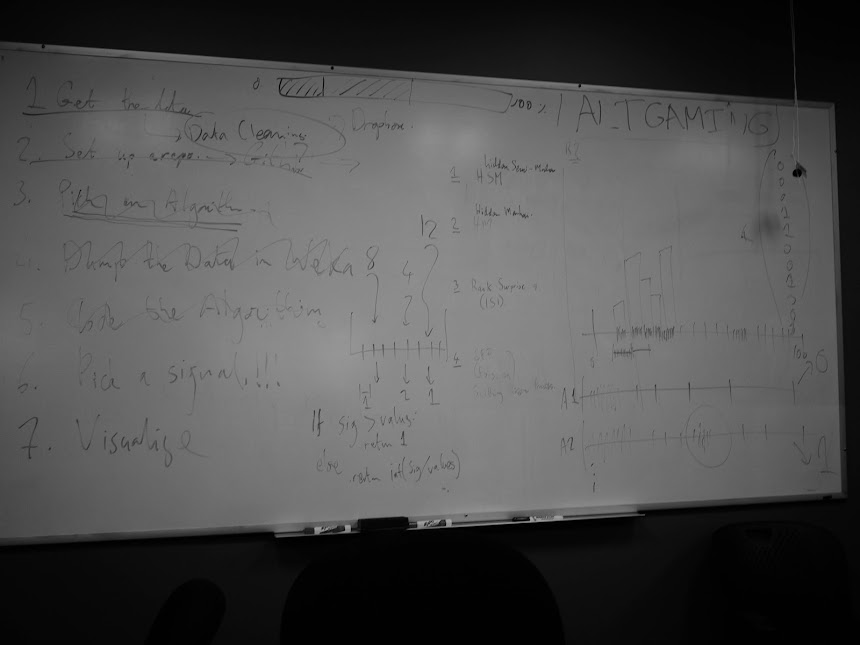
Results
We hoped to find a sampling of bursts then to visualize in order to study the spike train and its event arrival intervals. No bursts were identified from our data set when we implemented the program. Whether this was due to the technical implementation of the algorithm; the data; or the suitability of the algorithm, we need to conduct further preliminary work such as testing this model with a simpler method that examines the variance of article activity change across the corpus. We hope to continue to build an open source, automatic ALM burst detection tool that can be used across altmetrics providers.
Resources
The code we generated is on github. We used the literature in the Mendeley burst detection group to help focus on algorithms that might help. The data sets that we generated are in a dropbox folder. We generated one large dataset that can be used for testing algorithms against, however it will need to be converted into time series sub-data sets.
Some Takeaways
A lot of our time during the hack was spent getting data. In the end we had about three data sets floating around, with some differences in the scale of time that they covered, and the sources of information that were in them. A lot time was spent manipulating the data to generate a time series set in the right format for the algorithm we wanted to run, and we also ran into a few limitations of the API. One outcome is that our work picked up a bug in the PLOS ALM API which is now being fixed!
It was fun working in a small group, I’ve previously been involved in a couple of hackathons where I ended up working on my own ideas, still fun, but not as much fun.
Even with a really tightly focussed group, with the number of data sets that we had, we kept talking cross purposes about what was, or was not, in a specific data set. Communication is hard!!
We applied a state of the art algorithm, and ran into some difficulty because we didn’t really understand the domain of applicability of the algorithm. but from my own personal point of view, even though we didn’t
In terms of being productive at a hackathon, I think next time have a data set in the format you want it in, or an API in the format you want it in, leaves you in a better starting position, so either get the data ready before hand, or restrict the scope of what you are going to do, to ideas that interface really well with the format of the data that you have to hand.
What's next?
We could see, in an infamous paper about bats, that there were a couple of clear spikes of attention, so we know, a-priori, that there are events that show up in the kind of data that we have access to. We know that it would be interesting to be able to automate both the retrospective discovery of these kinds of events, and the ability to analyse a live stream of signals to see upticks in activity. We know that there are a bunch of algorithms out there that are well tuned to this task, so there is good scope to iterate on this work and set up some nice clean stream data, and some data work-flows for generating this kind of data from available APIs, while at the same time finding a suite of algorithms to toss the data at. At the same time there was a lot of discussion around how to understand the context of ALM numbers, or events, and we need to keep an eye on what it all means, and whether the events we might be able to pick up can be related to things happening in the real world.
(As a personal aside, I’ve been interested in Kleinberg’s algorithm since about 2007, but I never had the mathematical chops to code up my own version of the algorithm, and I never got the perl version to run, so I was delighted to find a package that I could try out, even if, in the end, it didn’t work. - Ian).